Gantt Chart & Budgeting
Gantt Chart
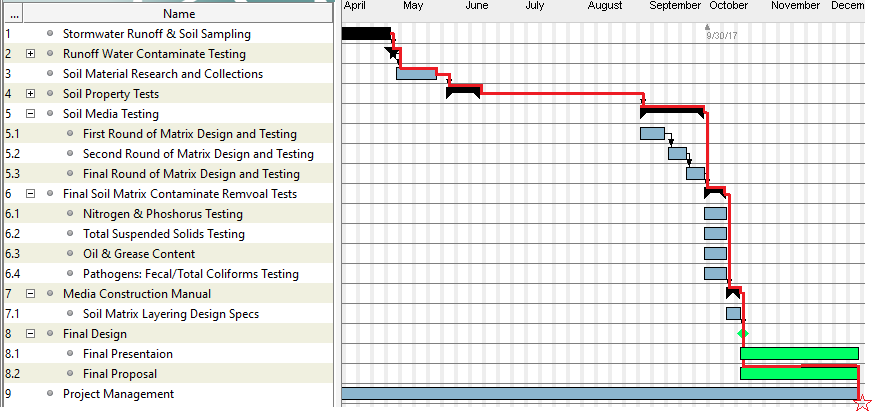
This estimated Gantt Chart shows the design tasks and its estimated start to end date. The black on the chart is our main tasks, blue is sub tasks, and green is our final design presentation and proposal. The red line shows the critical path of this LID design.
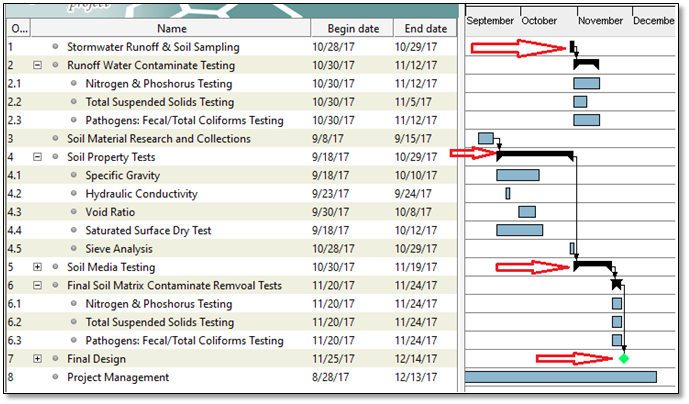
This figure shows the actual Gantt Chart for the LID design. Because of the time conflict on the lab access, the team could only use the Fall 2017 semester to do testing. The red arrows in the Actual Gantt Chart show the tasks that were pushed back.
Design Hours & Budgeting
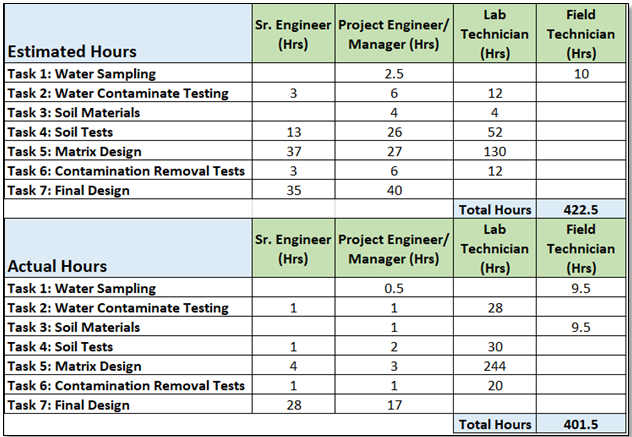
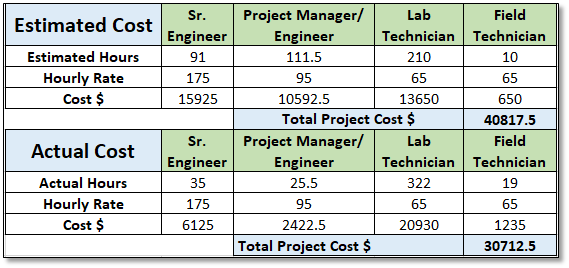
This shows the comparison of design hours and cost between estimate and actual design process. Overall, the estimated hours and actual hours are close, but the actual cost is lower than estimated.


